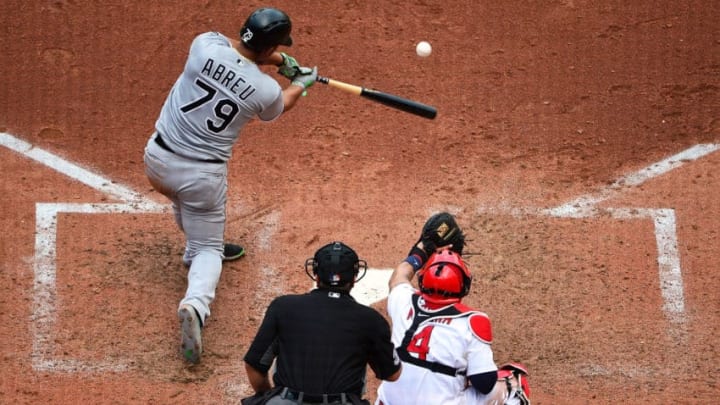
As May opens up, the White Sox continuing the fight to stay out of the basement in the AL Central.
And, despite the sub .300 win percentage, the White Sox are showing promise with offensive stats when compared to the 29 other MLB teams.
There are only three teams with lower win percentages than the White Sox. The list includes the Kansas City Royals, Baltimore Orioles, and Cincinnati Reds.
When it comes to batting average, only the Orioles are the worst AL team with an average of .221. They share this number with the Colorado Rockies, who are in second place in the NL West with a win percentage of .531.

Why batting average still matters
Some may say that batting average is an antiquated statistic; but in reality, it tells a comprehensive story. Batting average still tells us how often hitters get on base by putting the ball in play. It may not tell us how many bases they got on the hit, but that’s okay. It is an easy stat to understand and with the history of baseball, it is not going anywhere.
When batting average is looked at over several years, we can also see what is happening to the game. The current MLB batting average is .243. When comparing it to other years, this low batting average is telling a clear story: too many batters are not getting on base with balls in play. According to the reliable stats on Baseball Reference, in 2016 and 2017 the league average was .255. Ten years ago in 2008, the league batting average was .262. And, in 1998, the average was .266.
Where the Sox stand
So, where do the Sox stand in the batting average competition? Actually better than their win-loss record shows. They are smack dab in the middle at number 15 with a team average of .243. This puts them between the Dodgers who have an average of .244 and the Nationals with an average of .242.
The top three teams in batting average may come as a surprise: Tampa Bay is third (.265), Boston is second (.271), and Atlanta is first (.273).
More from White Sox News
- The Chicago White Sox might have had a season ending loss
- The Chicago White Sox are expecting Tim Anderson back soon
- Miguel Cairo’s words spark life into the Chicago White Sox
- Dylan Cease should be the favorite for the AL Cy Young Award
- Ozzie Guillen speaks the whole truth about Tony La Russa
With the Sox sitting in 15th in batting average, the team is creating offense. And, the Sox OPS story is even better. The team is in 13th in OPS with .727. This story is even better because it tells us that the Sox are getting at least one base 72.7 percent of the time a batter is at the plate. The Sox are producing hits. They just aren’t converting them to runs which explains the win-loss record.
Ideas to ponder
There are a few things to question. One is whether a lineup adjustment needs to be made to increase the chance that baserunners get home. Another is whether or not the pitchers are giving up too many runs. It is also worth wondering if baserunners are being picked off on the bases.
Next: Plenty of good things happening in April
The final question is whether or not the Sox will get closer to building a win-loss record that reflects the team’s batting stats?
